Habit Tracker
Regular price
$16.97
Sale price
$16.97
Regular price
$33.94
Unit price
Guaranteed Safe & Secure Checkout
Couldn't load pickup availability
Habit Tracker
Regular price
$16.97
Sale price
$16.97
Regular price
$33.94
Unit price


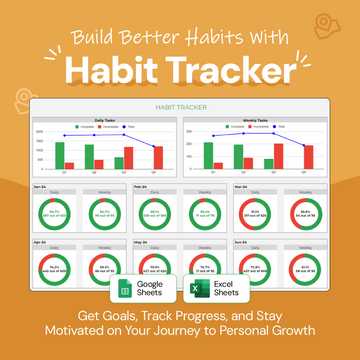
Tabs & Features Analyses
Google Sheets & Excel Version
Monthly Tab
Year-Round Task and Habit Tracker
- 12 Tabs for Year 2023: Effortlessly plan and track habits and tasks with 12 dedicated tabs, each representing a month for the year 2023.
- Auto-Highlight Current Date & Week: Stay on top of your schedule as the tab automatically highlights the current date and week, ensuring clarity in tracking.
- Daily and Weekly Progress Bars: Visualize task completion status with progress bars that dynamically represent daily and weekly achievements.

Monthly Tab Analyses
Insightful Progress Monitoring
- Daily & Weekly Task Sections: Maintain a structured routine with separate sections for daily and weekly tasks, ensuring a balanced approach to goal achievement.
- Auto-Highlight Current Date & Week: Stay informed and ready to tackle time-sensitive tasks with automatically highlighted current date and week.
- Daily & Weekly Progress Bars: Track the completion status of your daily and weekly tasks with visual progress bars that offer an at-a-glance overview.

Dashboard Tab
Comprehensive Performance Overview
- Yearly Stats of Daily & Weekly Tasks: Get a year-in-review with statistics of your daily and weekly tasks, facilitating informed decisions and future planning.
- Visual Task Breakdown: Understand task completion with bar charts showing completed, incomplete, and total tasks for daily and weekly routines.

Dashboard Analyses
Yearly Task Statistics
- Daily Tasks Section Breakdown: Evaluate daily tasks with a bar chart visualizing completed, incomplete, and total tasks, supporting effective task management.
- Weekly Tasks Section Breakdown: A bar chart for weekly tasks provides insights into your performance over extended periods, helping in identifying patterns.

Dashboard Analyses
Monthly Task Statistics
- Monthly Stats of Daily & Weekly Tasks: Keep an eye on monthly progress with stats on daily and weekly tasks, including completed tasks out of total and percentage completed.
- Task Completion Pie Charts: Visualize task completion with two pie charts - one for daily and another for weekly tasks. Green indicates completed tasks, while red signals incomplete tasks, offering a clear view of your achievements and areas that need attention.